
Climate Adaptation
Climate change has its own goal area under the 25 YEP, Mitigating and Adapting to Climate Change.
Climate adaptation is distinct from climate mitigation, which focuses on reduction of greenhouse gas emissions to support achievement of Net Zero. Adaptation to climate change is the process of adjustment to actual or expected climate and its effects, in order to moderate harm or exploit beneficial opportunities.161 The CCC states that ’without action on adaptation we will struggle to deliver key government and societal goals, including Net Zero itself. We cannot rely on nature to sequester carbon unless we ensure that our peat, our trees and our wetlands are healthy, not only today but under the climatic conditions we will experience in the future’.162
Given the relevance to many of the 25 YEP goal areas, we have therefore assessed climate adaptation within goal areas where appropriate assessments from the CCC are available.
Without climate adaptation, government is unlikely to achieve its 25 YEP goals, deliver a healthy environment that is resilient to future climate change or carbon sequestration at levels necessary to achieve Net Zero. The opposite is also the case; without a healthy and resilient environment, government is unlikely to achieve Net Zero. Climate change represents an increasing pressure on the environment, so mitigation and adaptation pathways must be considered as part of long-term environmental management.
Climate adaptation offers opportunities for the environment. Nature-based solutions can deliver multiple ecosystem services that benefit the environment, the economy, wellbeing and support adaptation to climate change. Natural flood management for example can reduce flood risk by storing or slowing runoff while creating habitats and improving river water quality. In catchments that supply drinking water, this can also reduce water company resource use and cost in the treatment process.
Actions laid out in the Second National Adaptation Programme163 aim to address climate risks and opportunities across multiple sectors, including the natural environment, infrastructure, health and the built environment and business. The cross-sectoral and context-specific nature of adaptation means it cannot be captured by a single indicator.
Many of the OIF indicators relevant to climate adaptation are still in development, or there are not enough data published to create a temporal trend. We have worked with the CCC and drawn on its biennial progress reports to develop a methodology to assess progress.
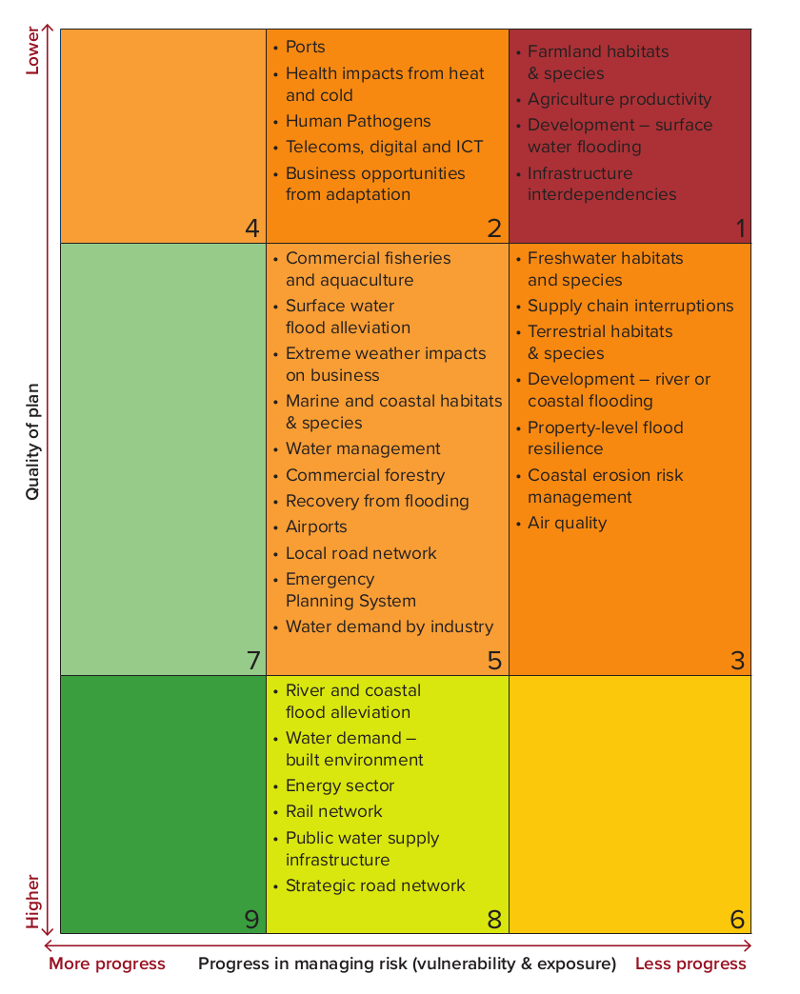
The CCC’s methodology includes two assessment criteria: management of the risk and the quality of plan(s) in place. The first criterion is underpinned by quantitative indicators that evidence risk magnitude over time (vulnerability and exposure indicators). The second (plan score), considers whether effective monitoring is in place, whether climate change is considered in plans and if there are clearly defined timebound targets or outcomes. Both criteria are given an assessment of low, medium or high and are used to place the given adaptation priority on a nine-box scoring grid (Figure A1). The CCC assesses Government’s progress in adapting to climate change biennially for 34 adaptation priorities (Table A17).
There is significant overlap between the 34 adaptation priorities and the 10 goal areas of the 25 YEP, so we provide an assessment of adaptation for each goal area where possible, alongside our assessment of the state of the environment.
To map the CCC’s 34 adaptation priorities to the 10 goal areas of the 25 YEP, we developed simple assessment criteria where:
- The scope of the CCC priority corresponded to one of the 10 goal areas of the 25 YEP. For example, the CCC priority ‘terrestrial habitats and species’ corresponded with Thriving Plants and Wildlife in the 25 YEP.
- Indicators that underpin the CCC progress scores (that is, the assessment of the magnitude of risk) corresponded to similar OIF indicators, or our other headline indicators. For example, the CCC priority ‘river and coastal flood alleviation’ corresponded with OIF indicator F2 ‘communities resilient to flooding and coastal erosion’.
- CCC adaptation priorities provided direct or proxy scoring across more than one goal area or indicator, so that progress scores could be read across.
Having developed these assessment criteria, we noted the CCC’s adaptation progress scores over the previous two biennial progress reports (2019 and 2021). We used the CCC’s nine-box grid scores (Figure A1) to develop 2021 to 2022 adaptation scores relevant to each 25 YEP goal area. Due to only having access to two data points for each adaptation score, we have limited this assessment to a qualitative commentary only. Furthermore, due to insufficient overlap between the CCC sectors, 25 YEP goal areas and our headline indicators, we have not been able to develop scores for two goal areas: Minimising Waste and Managing Exposure to Chemicals and Pesticides. Table A17 presents the breakdown and scoring by goal area.
| CCC adaptation priority | 25 YEP goal area | 2019 score | 2021 score | Key indicators used by CCC to assess risk management 164 |
|---|---|---|---|---|
| Natural Environment | ||||
| Terrestrial habitats and species (1) | TPW | 3 | 3 |
|
| Farmland habitats and species (2) | TPW | 1 | 1 |
|
| Freshwater habitats and species (3) | TPW/CPW | 5 | 3 |
|
| Coastal and marine habitats and species (4) | TPW | 5 | 5 |
|
| Commercial forestry (5) | Res/Biosec | 5 | 5 |
|
| Agricultural productivity (6) | Res/Biosec | 1 | 1 |
|
| Water management (7) | CPW/Res | 5 | 5 |
|
| Commercial fisheries and aquaculture (8) | Res | 2 | 5 |
|
| River and coastal flood alleviation (9) | Haz | 5 | 8 |
|
| Development in areas at risk of river or coastal flooding (10) | Haz | 3 | 3 |
|
| Surface water flood alleviation (11) | Haz | 2 | 5 |
|
| Development and surface water flood risk (12) | Haz | 1 | 1 |
|
| Property-level flood resilience (PFR) (13) | Haz | 3 | 3 |
|
| Capacity of people and communities to recover from flooding (14) | Haz | 5 | 5 |
|
| Coastal erosion risk management (15) | Haz | 3 | 3 |
|
| Water demand in the built environment (16) | CPW/Res | 8 | 8 |
|
| Health impacts from heat and cold (17) | N/A | N/A | N/A |
N/A |
| Risks to people from pathogens (18) | Biosec | 2 | 2 |
|
| Air quality (19) | Air | 3 | 3 |
|
| Effectiveness of the emergency planning system (20) | N/A | N/A | N/A |
N/A |
| Infrastructure | ||||
| Infrastructure interdependencies (21) | N/A | N/A | N/A |
N/A |
| Design and location of new infrastructure (22) | N/A | N/A | N/A |
N/A |
| Energy generation, transmission and distribution (23) | N/A | N/A | N/A |
N/A |
| Public water supply infrastructure (24) | CPW/Res | 8 | 8 |
|
| Ports (25) | N/A | N/A | N/A |
N/A |
| Airports (26) | N/A | N/A | N/A |
N/A |
| Rail network (27) | N/A | N/A | N/A |
N/A |
| Strategic road network (28) | N/A | N/A | N/A |
N/A |
| Local road network (29) | N/A | N/A | N/A |
N/A |
| Telecoms, digital and ICT infrastructure (30) | N/A | N/A | N/A |
N/A |
| Business | ||||
| Impact on business from extreme weather events (31) | N/A | N/A | N/A | N/A |
| Supply chain interruptions (32) | N/A | N/A | N/A | N/A |
| Water demand by industry (33) | CPW/Res | 5 | 5 |
|
| Business opportunities from climate change adaptation (34) | N/A | N/A | N/A | N/A |
| CCC adaptation priorities and 25 YEP goal areas | ||||
| 25 YEP goal areas | Relevant CCC adaptation priorities | |||
| Clean Air (Air) | 19 | |||
| Clean and Plentiful Water (CPW) | 3, 7, 16, 24, 33 | |||
| Thriving Plants and Wildlife (TPW) | 1, 2, 3, 4 | |||
| Reduced Risk of Harm from Environmental Hazards (Haz) | 9, 10, 11, 12, 13, 14, 15 | |||
| Enhancing Beauty and Engagement | We could not identify comparable CCC climate adaptation priorities | |||
| Mitigation and Adaptation to Climate Change | Not applicable in this analysis. CCC adaptation priorities have been mapped to their corresponding 25 YEP goal areas | |||
| Using Resources from Nature More Sustainably and Efficiently (Res) | 5, 6, 7, 8, 16, 24, 33 | |||
| Minimising Waste | We could not identify comparable CCC climate adaptation priorities | |||
| Managing Exposure to Chemicals and Pesticides | We could not identify comparable CCC climate adaptation priorities | |||
| Enhanced Biosecurity (Biosec) | 5, 6, 18 | |||
- Intergovernmental Panel on Climate Change, Climate Change 2022: Impacts, Adaptation and Vulnerability Glossary, 2022, https://
www.ipcc.ch/report/ar6/wg2/downloads/report/IPCC_AR6_WGII_Annex-II.pdf. - Climate Change Committee, Independent Assessment of UK Climate Risk.
- Department for Environment, Food and Rural Affairs, Climate Change.
- Climate Change Committee, Progress in Adapting to Climate Change 2021 Report to Parliament.